
There is a difference between investment and speculation. A speculator buys stocks hoping for a short-term gain over the next days or weeks. An investor buys stocks likely to produce a dependable future stream of cash returns and capital gains when measured over years or decades. A successful investor is generally a well-rounded individual who puts a natural curiosity and an intellectual interest to work to earn more money. Fundamental analysis of stocks is the best method to analyze the stocks for Investing.
There are two methods for the analysis of stocks-Technical analysis and Fundamental analysis. Firstly, Technical Analysis is a method of predicting the appropriate time to buy or sell a stock used by those believing in the castle-in-the-air view of stock pricing. Whereas, the fundamental analysis is the technique of applying the principle of the firm-foundation theory to the selection of individual stocks.
What is Fundamental Analysis of Stocks?
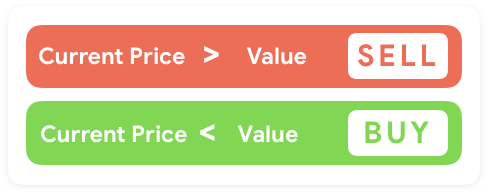
Fundamentalists seek to determine a stock’s proper value. The value refers to a company’s assets, its expected growth rate of earnings and dividends, interest rates, and risk. By studying these factors, the fundamentalists arrive at an estimate of firm’s foundation of value. If this value is above the market price, then the investor is advised to buy.
Traditionally, the pros in the investment community have used one of two approaches to asset valuation:
- The firm-foundation theory
- The castle-in-the-air theory
Firstly, the firm-foundation theory argues that each investment instrument, be it a common stock or a piece of real estate, has a firm anchor of a concept called intrinsic value The careful analysis of present conditions and future prospects determines the intrinsic value. Whereas, the castle-in-the-air theory of investing concentrates on psychic values. John Maynard Keynes, a famous economist, and successful investor enunciated this theory most lucidly in 1936. This theory says that the successful investor is the one who beats the gun by estimating what investment situations are most susceptible to public castle-building and then buying before the crowd
Why you should do the Fundamental Analysis of Stocks?
Fundamental analysis helps you to understand which stocks to buy for the purpose of long term investing. It helps you to determine the value which can be compared against the current price of the stock. As a result,fundamental analysis helps to select the right stock for investment purpose.
What are the types of Fundamental analysis of stocks?
- Quantitative Analysis
- Qualitative Analysis
Qualitative Analysis
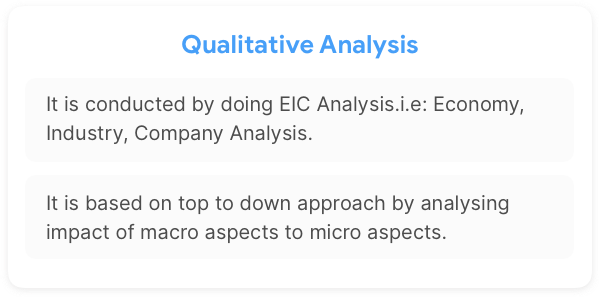
Economic Analysis
Firstly, the economic analysis considers the variation in the value of the stock on the basis of how the economy is performing. The economic situations prevailing in the country determines the prices of the shares in the stock market. If the economy is developing, then there are chances of stocks performing better or vice versa. The key economic variables due to which prices of stock changes are
- Growth Rates of National Income
- Inflation
- Interest Rates
- Exchange rates
- Infrastructure
- Monsoon
- Economic and Political Stability
Industrial analysis
Secondly, the industry analysis is a type of business research that focuses on the status of industry or an industrial sector. However, the economy is performing, the performance of the industrial sector depends on the demand for goods, the cost of raw material, technological changes, etc.
Company analysis
Thirdly, the company analysis concerns itself with the estimation of return and risk of individual shares. There are two types of information group regarding companies: Internal and External. The Internal source of information is the information that the company has released on its websites and other sources. The External sources of information are information published by sources other than the company itself like media, investment companies, etc.
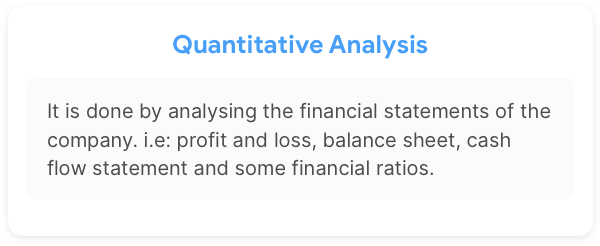
Quantitative Analysis
Price to Earnings Ratio (P/E)
The price to earnings ratio shows the relationship between company’s share price and earnings per share. It denotes how much the company is willing to pay for a company’s profit. It is calculated by the following formula:
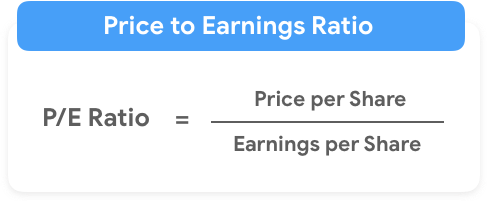
If the company have a higher P/E ratio then the stock is considered to be growth stock. If the company has a low P/E ratio then the stock is considered to be undervalued stock which is an indicator of the weak performance of the company.
However, the companies may seem unprofitable now but are likely to turn profitable in the future like Amazon, Flipkart, Swiggy, Zomato, etc. So it is not always advisable to rely on the P/E ratio only.
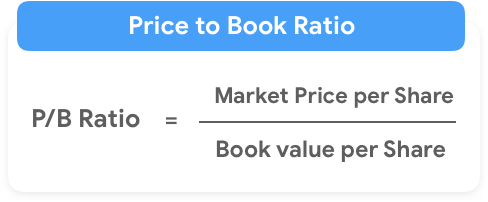
Price to Book Ratio (P/B)
Price to book ratio compares the market value of a company’s share to its book value. This investment valuation ratio indicates how shareholders are paying for a company’s net assets. Low ratio represents a good sign for the company because it helps to conduct a thorough analysis of the stock.
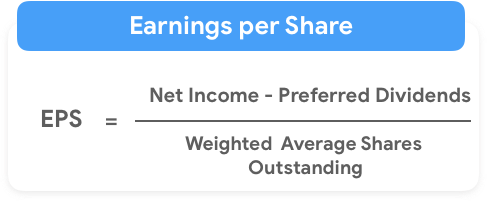
Earnings Per Share (EPS)
EPS shows the portion of a company’s profit allocated to each outstanding share. EPS serves as an indicator for company’s profitability and important component of the P/E ratio.
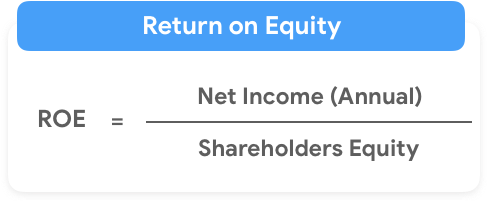
Return on Equity Ratio
The return on equity ratio is a profitability ratio. It measures the ability of a firm to generate profits from its shareholder investments in the company. The higher the ratio percentage, the more efficient management is in utilizing its equity base and the better return it to investors.
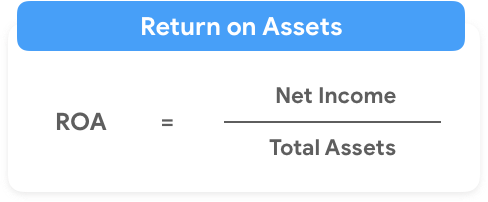
Return on Assets Ratio (ROA)
It is a profitability ratio that measures how efficiently a company can manage its assets to produce profits during a period. The high ratio is favorable to investors because it shows that the company is effectively managing its assets to produce a greater amount of net income.
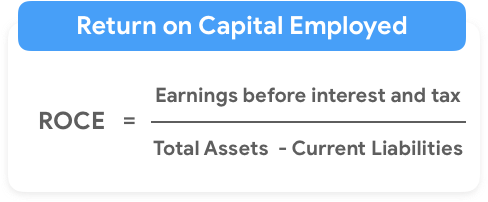
Return on Capital Employed (ROCE)
It is calculated by dividing the capital employed of the company to the net operating profit earned. A higher ratio would be more favorable because it means that the profit earned is high for every rupee of capital employed.
Total Debt to Equity Ratio (D/E)
The Debt to Equity ratio indicates how much debt a company is using to finance its assets. A high debt/equity ratio generally means that a company is focusing on financing its growth with debt which indicates a high level of risk.
Current Ratio
The current ratio shows that how much a firm is able to pay short-term and long-term obligations is called current ratio. The higher the current ratio, the more capable the company is of paying its obligations. So, the value above 1 indicates that company’s assets are greater than company’s liabilities. Whereas, the value under 1 indicates that a company’s liabilities are greater than its assets and indicates that the company may be unable to pay off its obligations if they came due at that point.
Profit & Loss Statement
The income statement presents information about revenues, expenses, and profit generated from the business operation during that period. Hence, the fundamental analysis considers the previous 5 years’ income statement and try to analyze the sales, expenses and profit figures.
Balance Sheet
The balance sheet gives clarity about how the company/stock has build wealth over the past year, where the company is generating revenues to run its business and It also makes clear, where the company is using those funds. Learn more about the balance sheet here.
Cash Flow Statement
The statement of cash flow represents a record of a business cash inflows and outflows over a period. A good cash flow statement is that in which operation activity is positive and financial and investment activity is negative. In fundamental analysis, we analyze cash flow statements for the previous 5 years.
Since now you came to know about Fundamental Analysis in Stock Market. Now let’s know about Technical analysis in the stock market and the difference between fundamental and technical analysis of the stock market .
Finally, we hope you like our article on Fundamental analysis of Stocks very helpful. Please subscribe to our newsletter and never miss the opportunity to get the article directly to your inbox. Learn from StoxMaster – Stock Market Training Academy and get trained to trade. You can also learn for Free from our Free YouTube Videos .